WEBSITE REDESIGN · MOTION · SOCIAL · 2025–2026
Mormonism Explained
Visit the live site ↗
Role
Web design, motion and social
Timeline
12 months
Result
8.6× follower growth
Tools
Figma, Adobe CC, Remotion, Claude

The results
8.6×
Instagram follower growth in 12 months, from 876 to 7,563
557
New Instagram followers a month, on average
01 — Overview
Making careful research easy to find, trust and share.
Mormonism Explained is a 501(c)(3) nonprofit that publishes in-depth, sourced writing on Mormon history, doctrine and church finances. I redesigned its website and created motion and social content that brought that research to the people it was written for.
THE CHALLENGE
Turn long, careful articles on sensitive subjects into a website and short-form content that people would stop for, trust and share.
MY ROLE
Website redesign, motion graphics and social design, including the “By the Numbers” reel and the carousels featured below.
THE TEAM
Part of an agency team, working with Mormonism Explained’s writers and researchers, who own every script and source.
MY PERSPECTIVE
I’m not religious. I came to this as a designer: my job was to make careful research clear, credible and easy to engage with, for believers and skeptics alike.
02 — The starting point
Before the redesign, Mormonism Explained had 876 Instagram followers, so very little of its research reached people where they actually spend their time.
The work had to earn attention in seconds without giving up the careful sourcing that makes it credible, on a subject where trust is hard to win from every side.
03 — The website
I redesigned mormonismexplained.org around one idea: sourced research should feel as easy to browse as a news site. A video-first homepage, clear topic hubs, a newsroom and a full video library give every article and episode an obvious place to live, and structured article, FAQ and author data helps people arriving from Instagram, and search engines, find their way.
KEY INSIGHT


04 — Featured reel · By the Numbers
3,556 likes in just over two weeks.
A motion graphic on which U.S. religion attends church most, built from Pew’s 2023–24 Religious Landscape Study. Torn paper labels, archival textures and one clear number per scene turn a dense dataset into a story people wanted to send to someone else: 3,135 shares, 202 reposts and 98 comments in the same two weeks.
MY PROCESS · REMOTION + CLAUDE
I build reels like this in code. I storyboard each scene and set the look, then work with Claude to write the Remotion components that animate the type, torn-paper labels and transitions. Because the video is React code, a corrected figure or a tighter cut is a quick edit and re-render instead of a rebuilt timeline, and the same components carry over to the next reel.
Watch the reel on Instagram ↗


05 — Social content
Carousels and infographics, built to be saved.
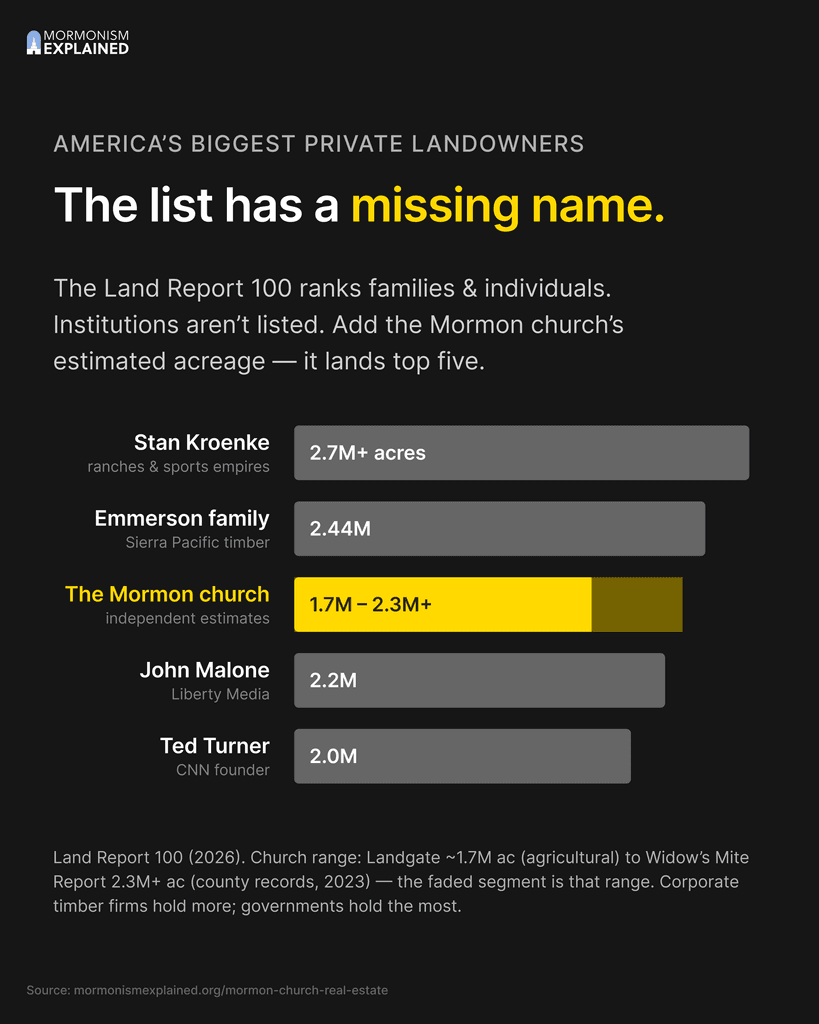
Two investigations, built as swipeable carousels: how much land the Church owns, and how the creed that defines “Christian” came to be. Each slide makes one point, cites its source and labels every number by how well it’s documented.



LONG-FORM INFOGRAPHIC
One story, one scroll.
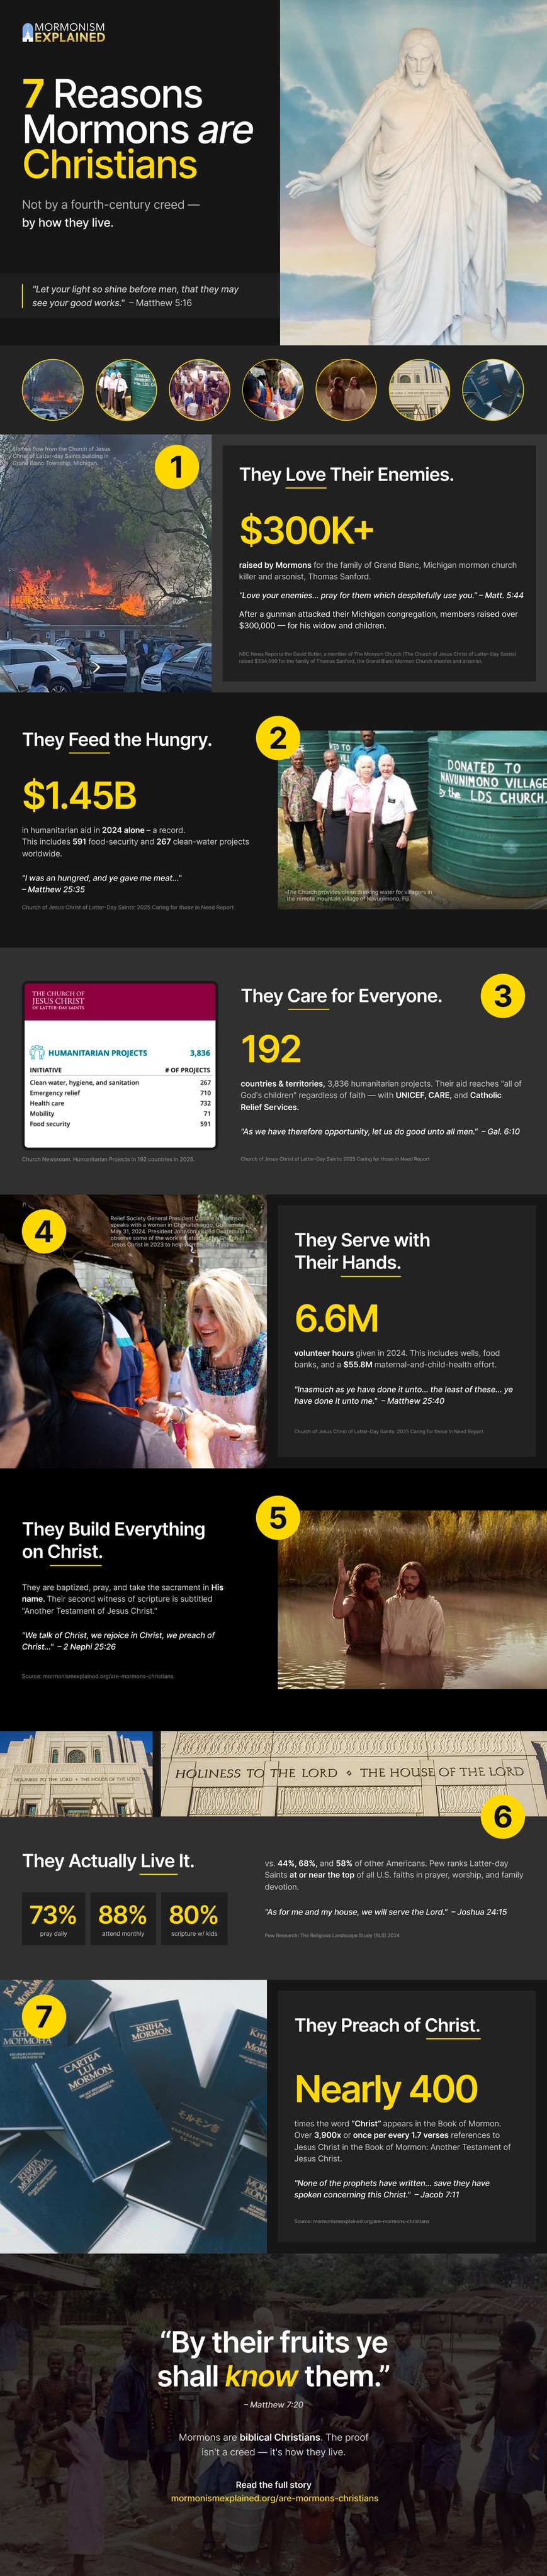
A tall, swipe-friendly infographic that walks through seven claims, each with a headline number, a photo and its source, so the whole argument reads in one scroll.
06 — Key decisions
Three calls that shaped the work.
01
One number per scene
The problem
Pew’s Religious Landscape Study is dense, and a reel has about three seconds to earn attention.
The decision
Every scene carries a single statistic, set large, with a torn-paper label so the eye knows exactly where to land.
Why it worked
One clear number is easy to remember and easy to repeat, which is what people did: 3,135 shares in just over two weeks.
02
Show how sure each number is
The problem
On a topic this divisive, believers and skeptics both question every figure.
The decision
Every number is labeled Documented, Estimate or Data gap, with its source printed right on screen.
Why it worked
Showing the evidence, not just the claim, gave readers on both sides a reason to trust the work instead of arguing with it.
03
Give followers somewhere to go
The problem
Posts were earning attention, but the research behind them had no clear home to send people to.
The decision
A video-first homepage, topic hubs and a newsroom, with every post pointing back to its full article.
Why it worked
Curiosity on Instagram turns into reading on the site, and structured article and FAQ data helps search engines find it too.
07 — Outcome
876
Instagram followers at the start
7,563
Instagram followers 12 months later
What I learned
On a topic this sensitive, trust is the design problem. The posts that performed best answered one clear question and showed their sources on screen. And a real system of storyboards, a shared visual language and a fast production pipeline is what let a small team stay consistent long enough to grow.
Next project
Porrazzo Rawlings
A rebrand, logo and website for a Utah injury firm, carried into infographics, a 30-second spot, reels and ads.
View project →

GET IN TOUCH
Let’s make something people want to share.
I’m open to full-time roles and freelance projects in web design, motion and social content.